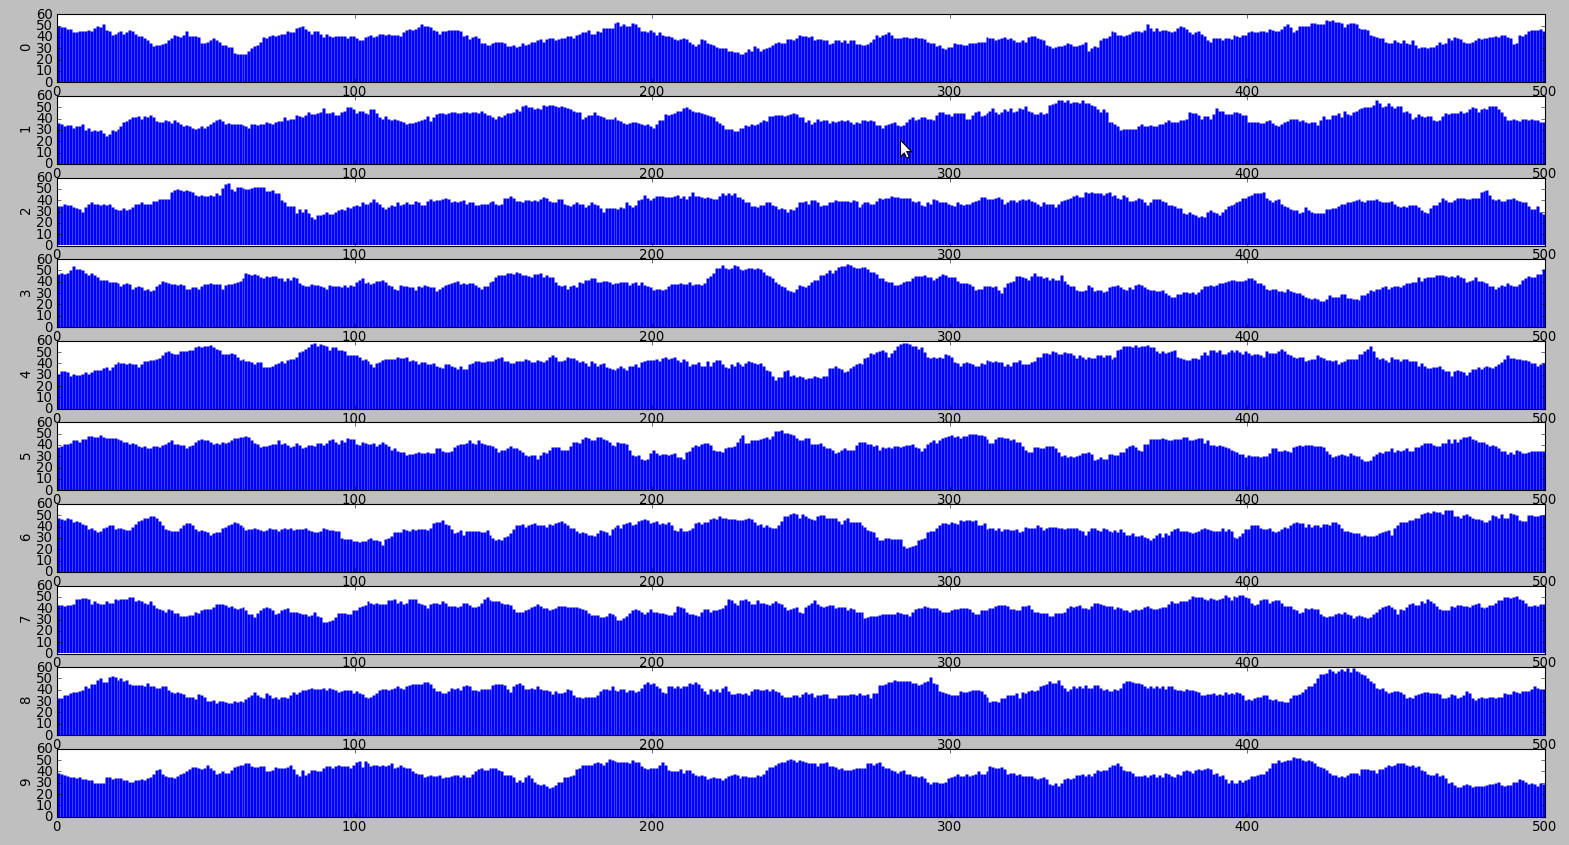
Hmmm, pi is a little bumpier than I thought. (It could just be that my statistical intuition is off, though.)
Each bar plot below represents the number of occurrences of a digit in the decimal expansion of pi. The y-axis is an index, and the frequency x is counted over the range of digits y*20 to y*20+400. I thought 400 would be a long enough length to make these graphs pretty flat. Higher lengths make it flatter, of course, but still not to the degree that seems ‘right’ to me.
I guess I could calibrate my perception by using a uniformly distributed sequence of digits…
Update: huh. I guess it is just me. Here’s the same sort of graph but with uniformly random digits (at least, assuming that RAND’s book, which I lazily selected as my source, is indeed uniform). Looks equally bumpy to me. Ah well, I’ll leave the post up as a reminder of my folly…
One comment